Verizon
Answering outage questions before customers call
Network problems drive calls to Verizon support. On Verizon.com and in the My Verizon app, I designed the Network Status Hub, outage updates and an outage map so customers could answer three questions without calling: What’s happening? Does it affect me? When will it be fixed?
Calls about network connection issues fell 1.48% over a year.
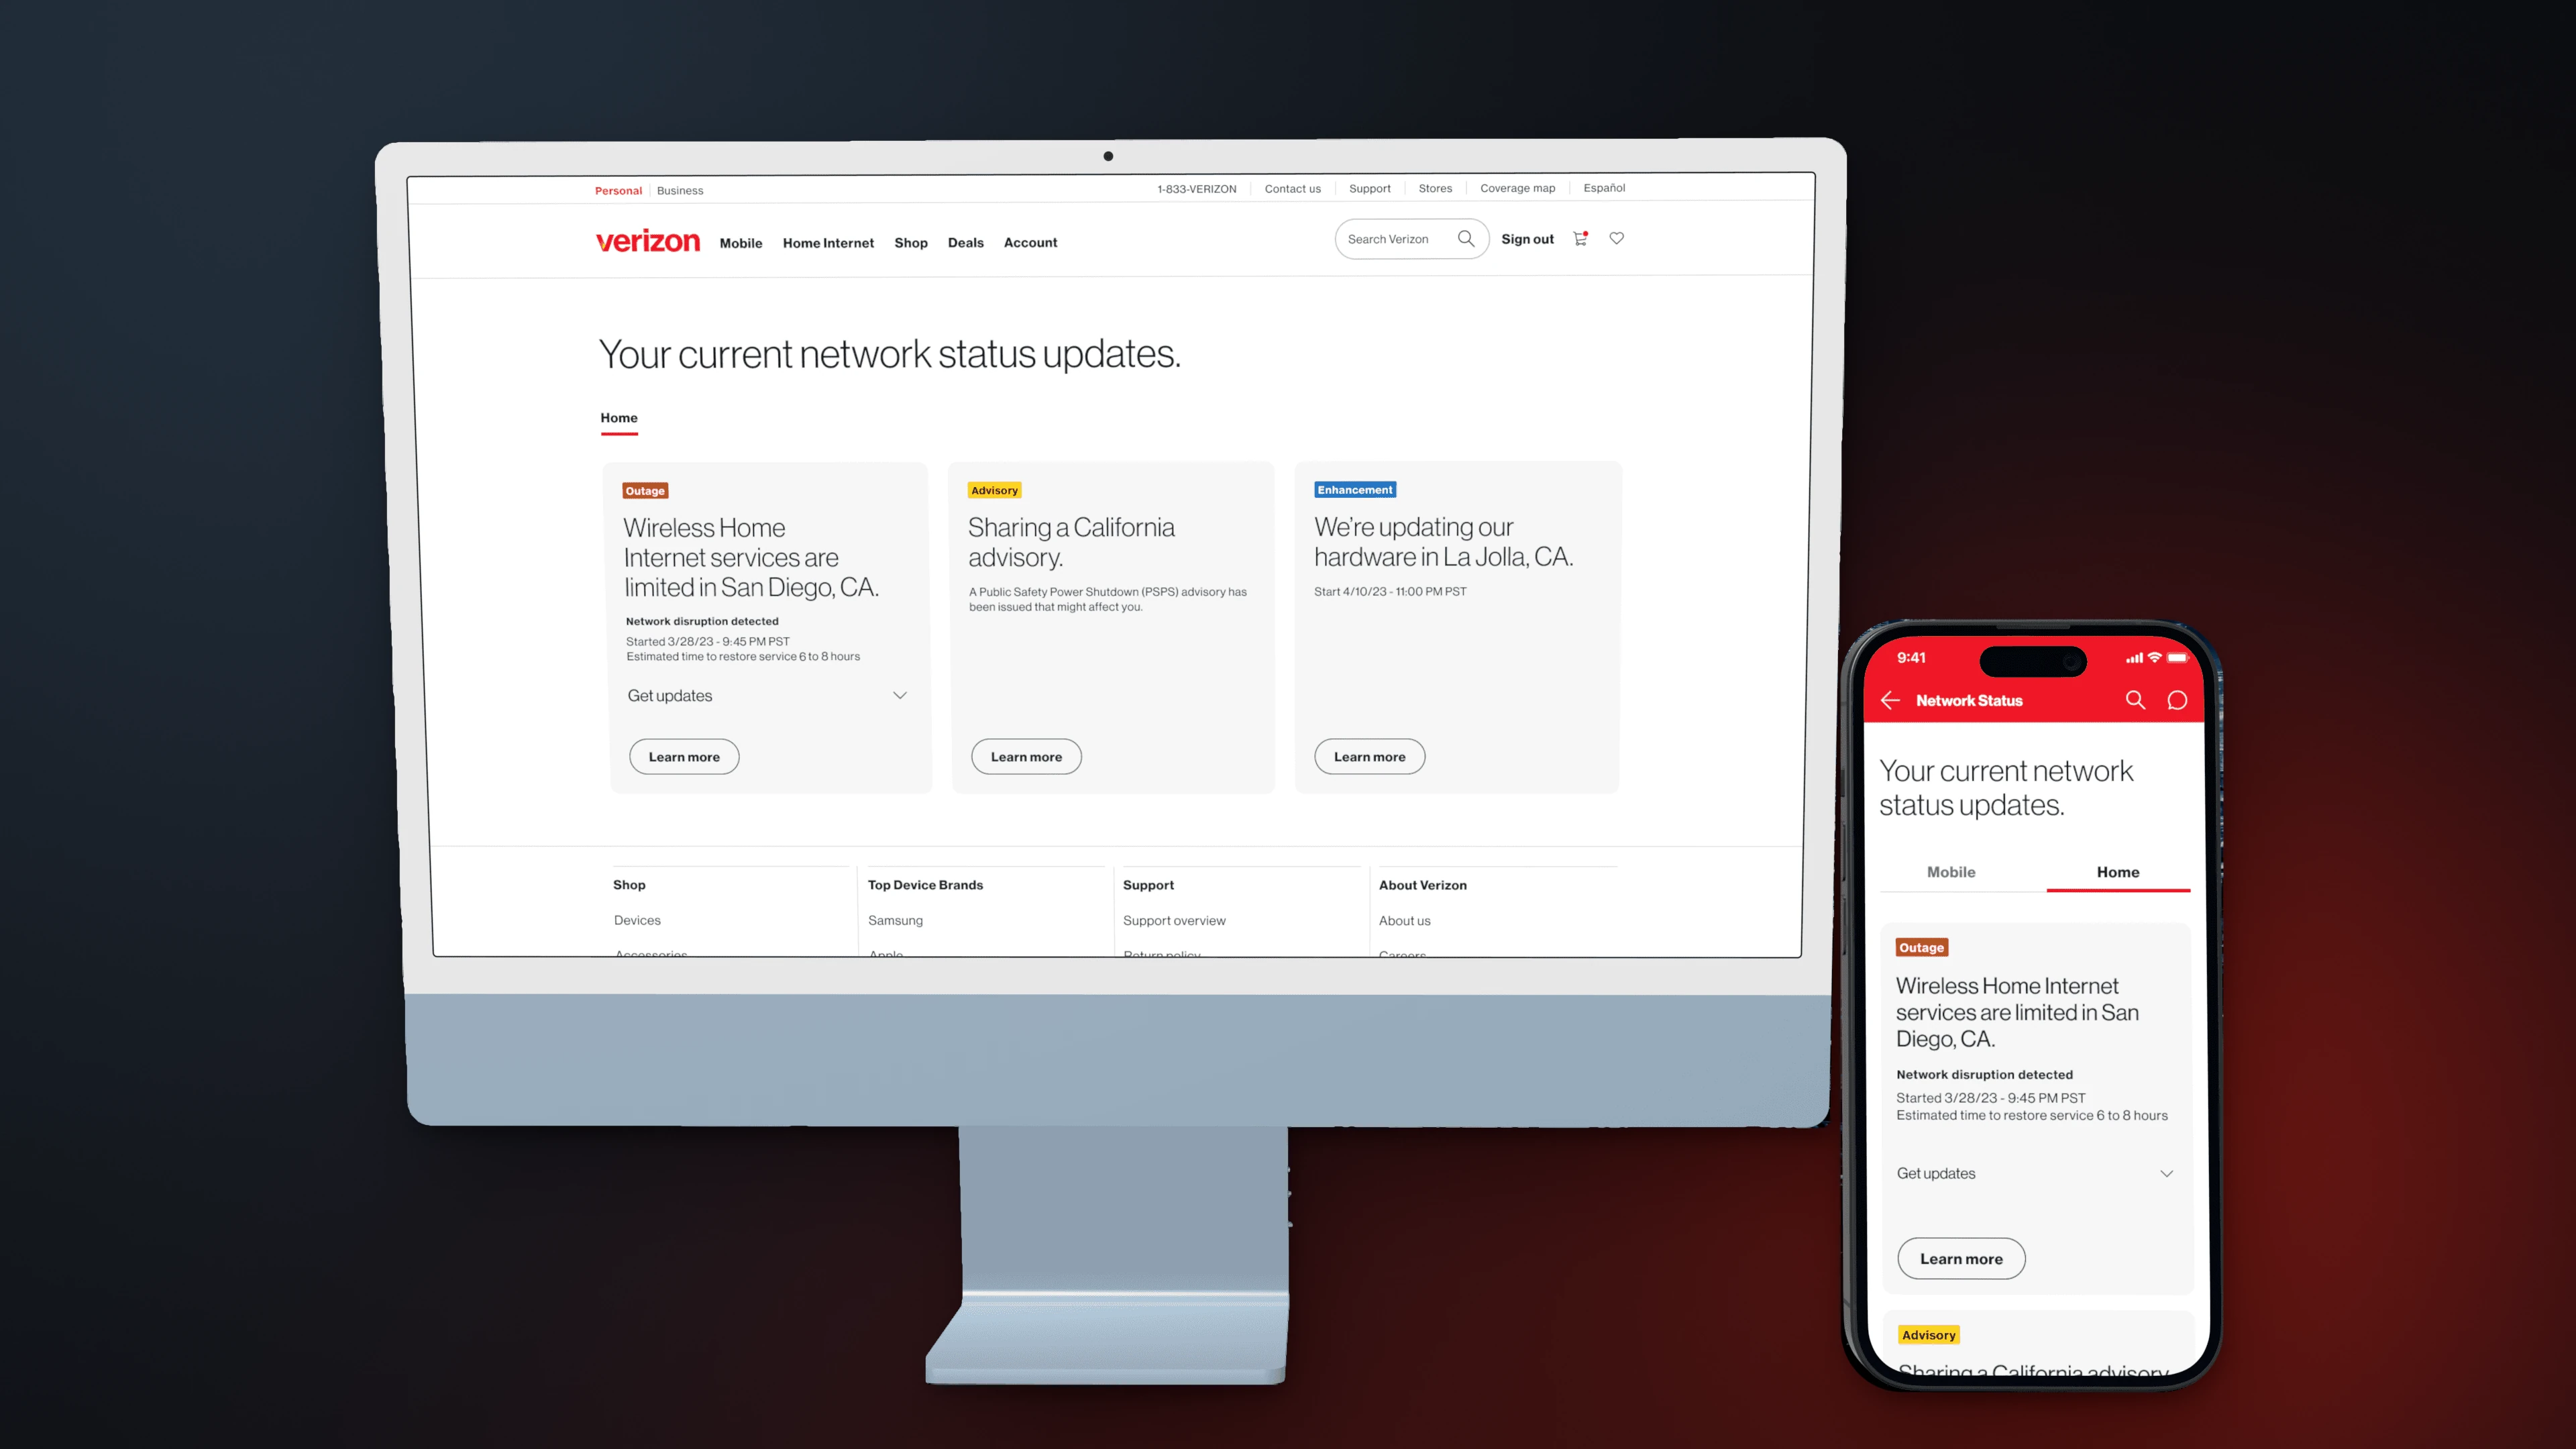
One alert at a time, one dot on a map
Alerts showed one event at a time, and the newest replaced the rest, so next week’s maintenance notice could bury today’s outage. Outages showed up as a single point, like “Atlanta, GA”, whether they covered one neighborhood or several states. Customers couldn’t tell if they were affected, so they called.
What’s happening? Every event in one place
A colleague’s service blueprint had already routed every channel (app, text, email and Verizon.com) to one hub. I took over from there and designed the hub itself. Four event types share one Verizon Design System tile, told apart by a colored tag: unplanned outages, voice outages, planned maintenance, and the power-shutdown notices California requires.
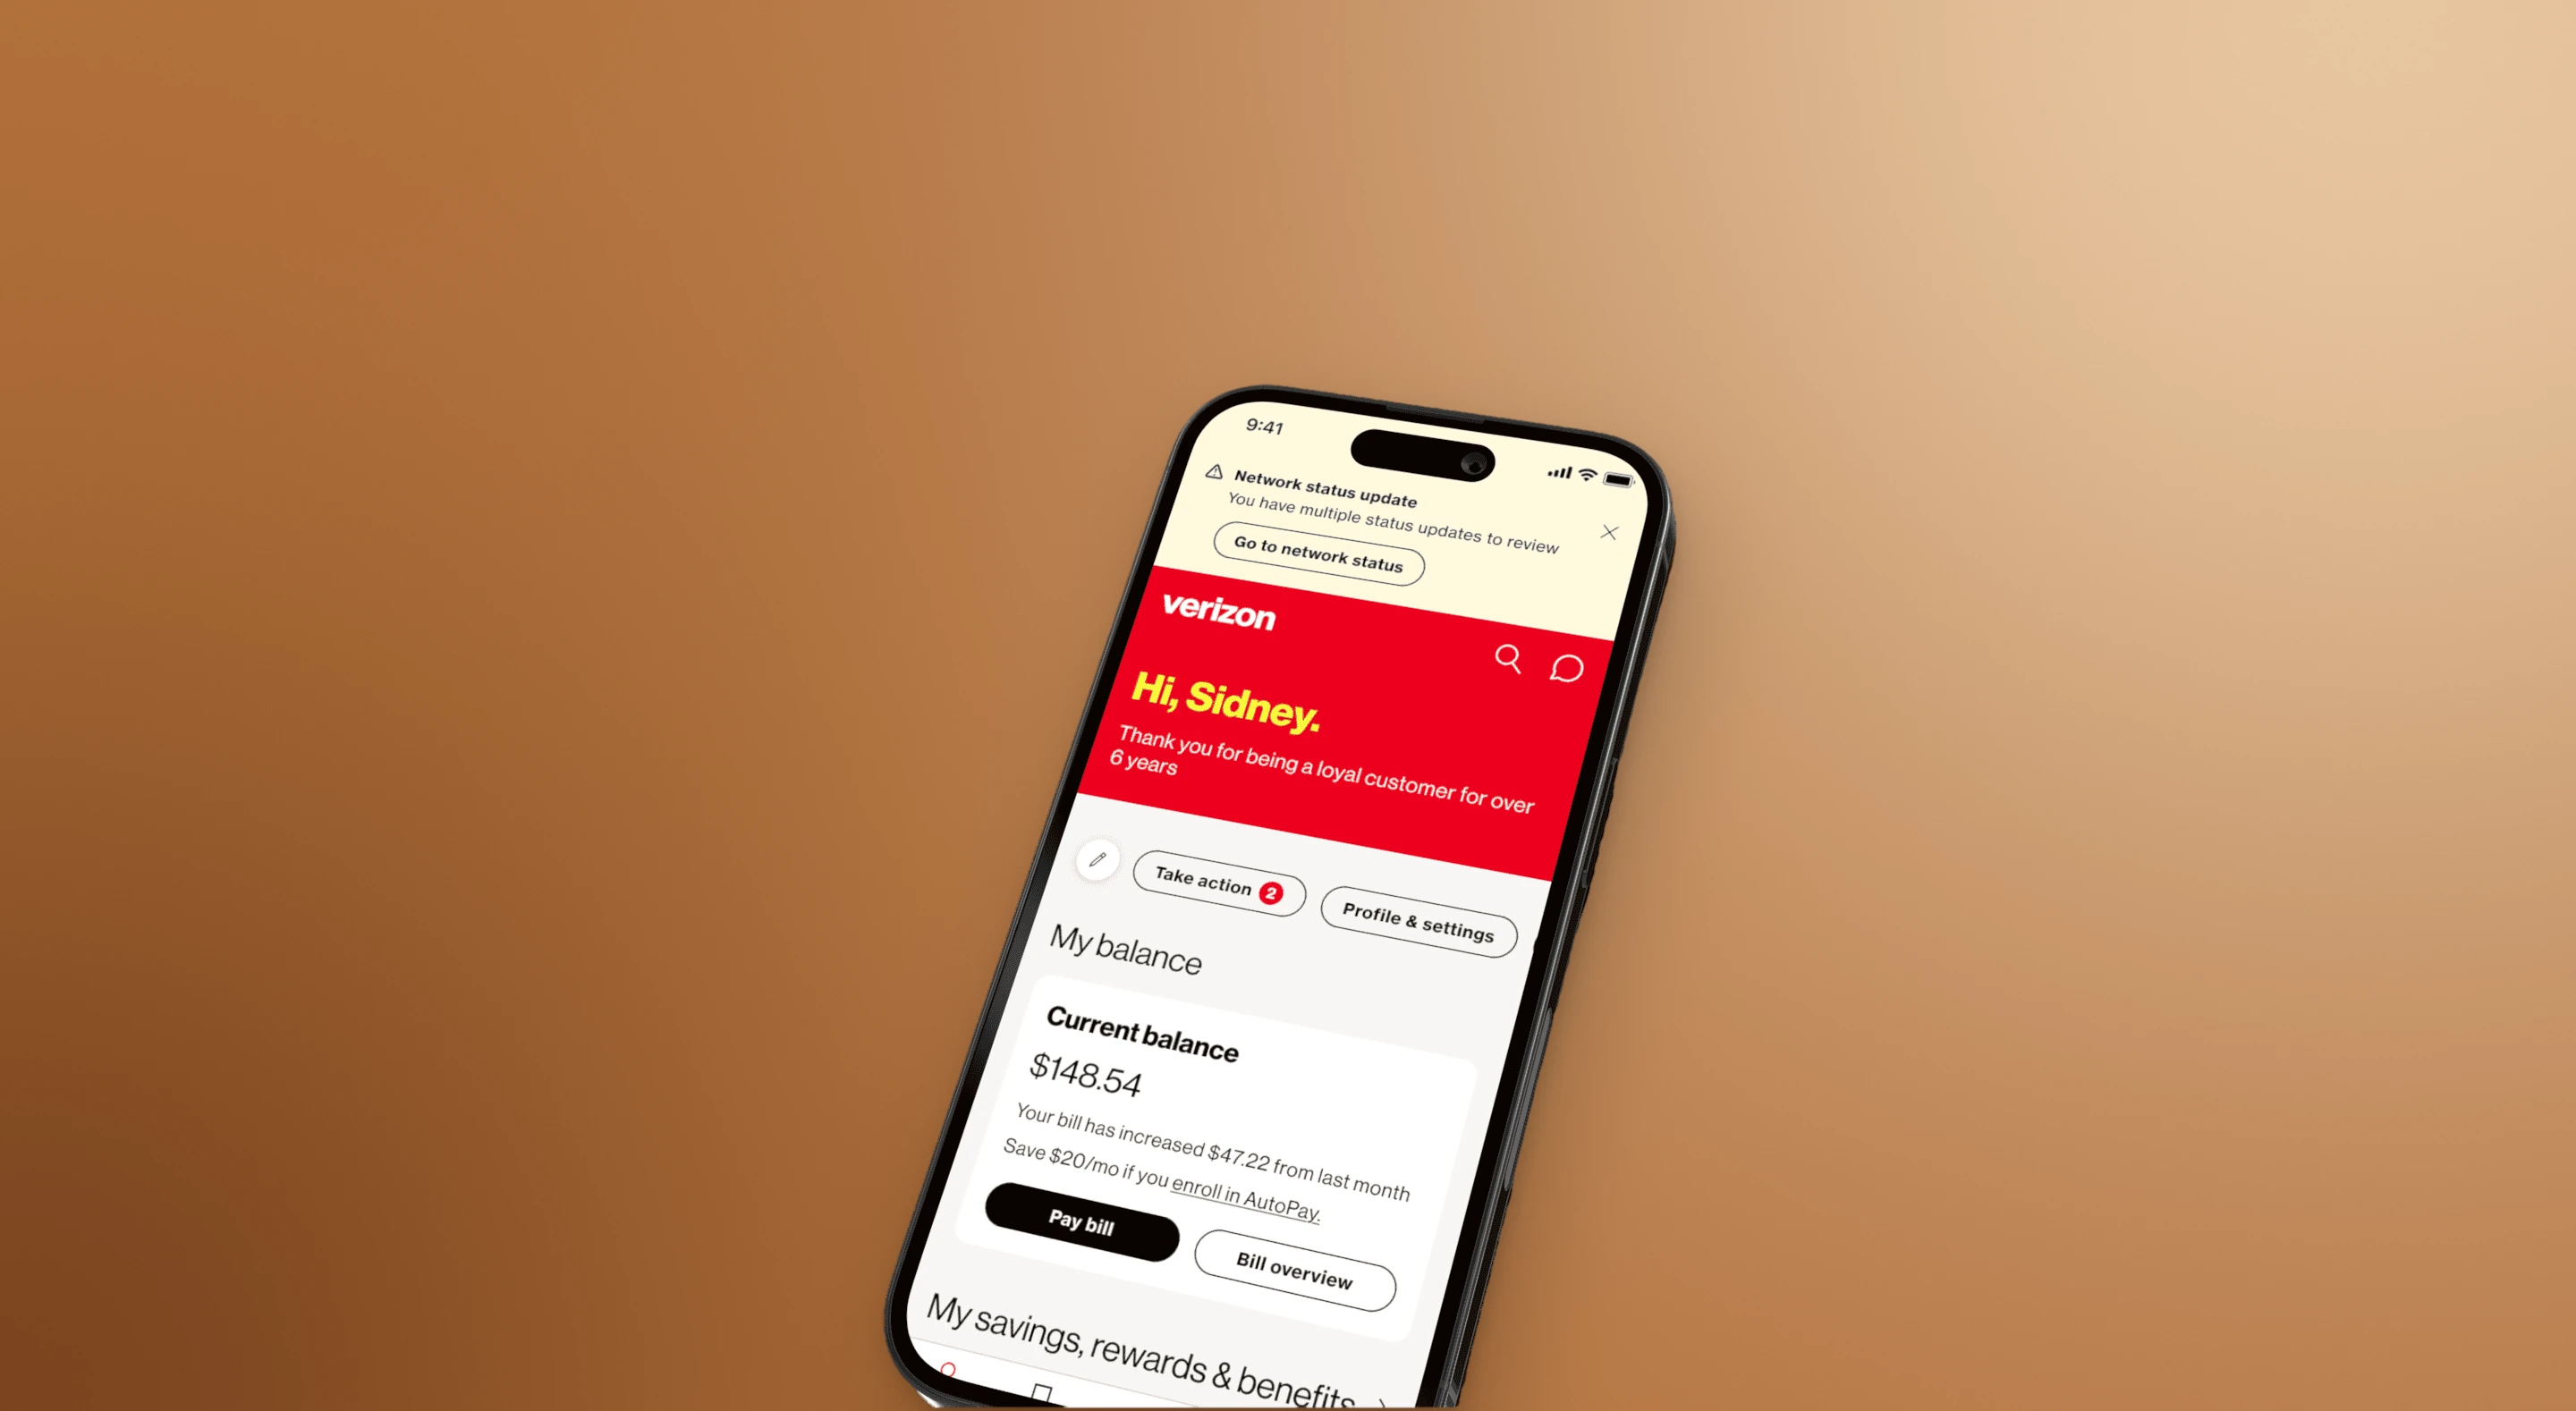
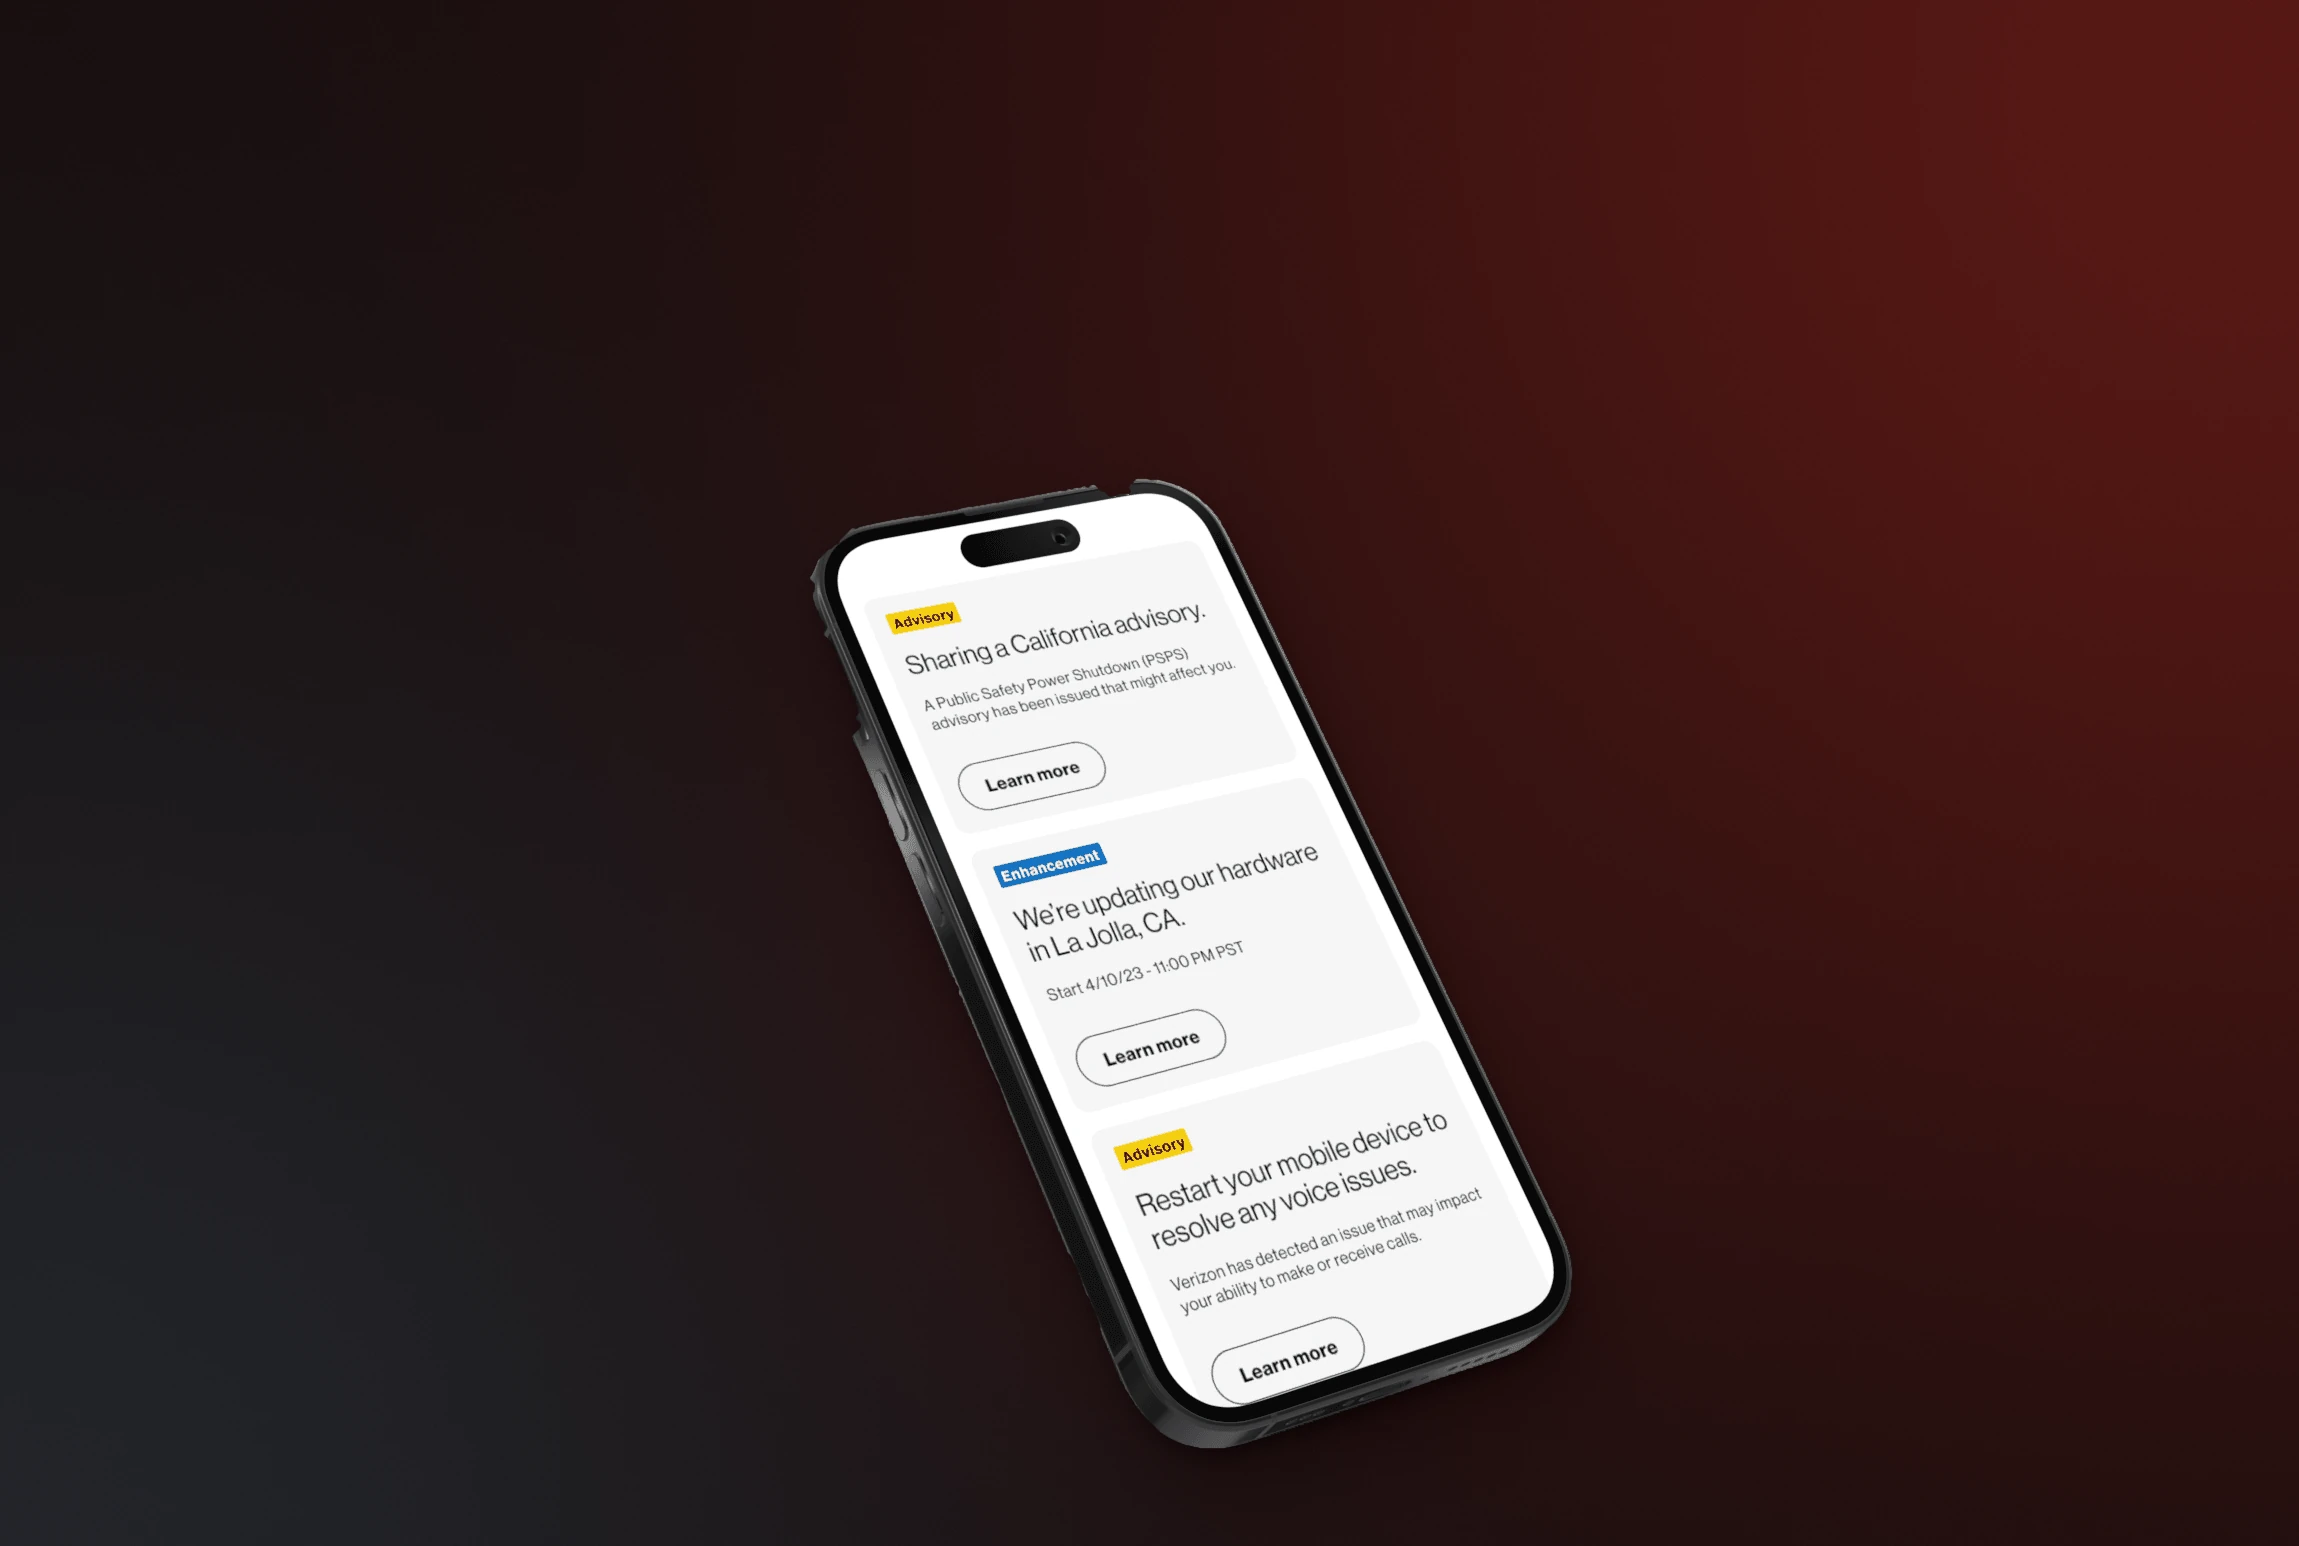
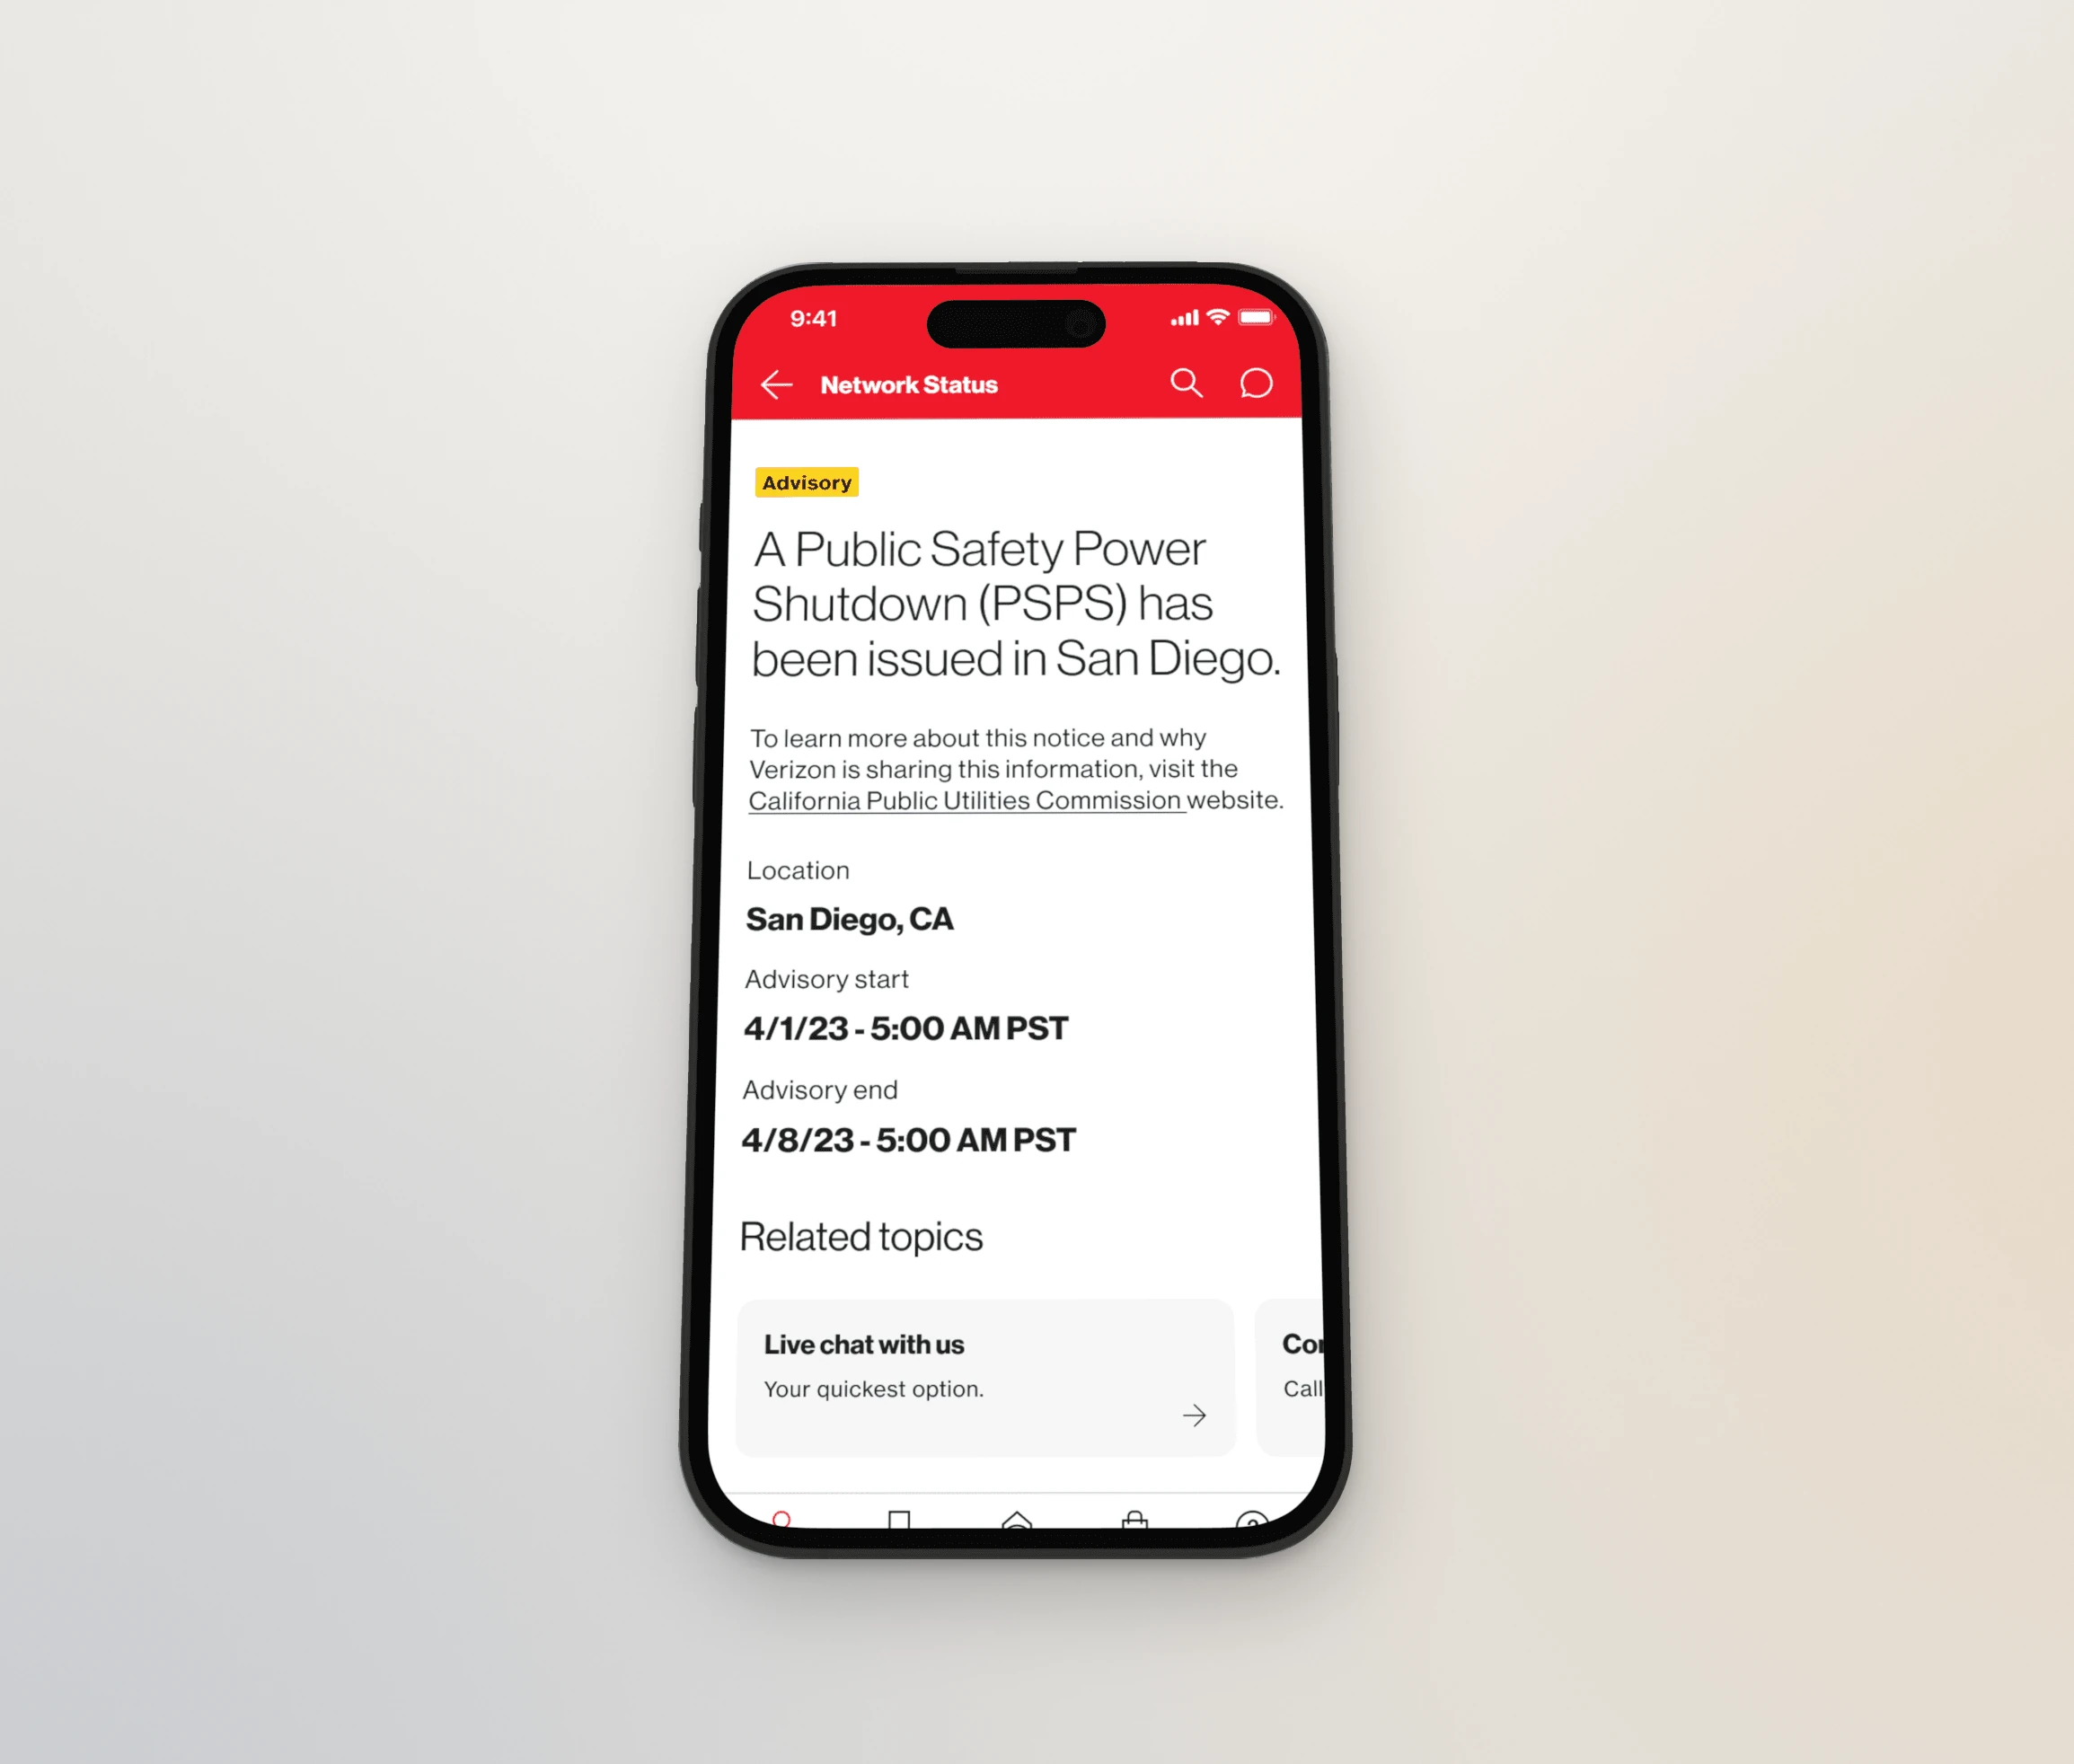
Testing showed customers trusted the alerts but mixed up outages and advisories. I proposed splitting Current from Upcoming, with a tooltip on each tag. The launch date didn’t move, so the fix got pushed past the MVP.
When will it be fixed? Updates that come to you
Customers can opt into a text or email at each restoration milestone, so they don’t have to call and ask for an estimate.
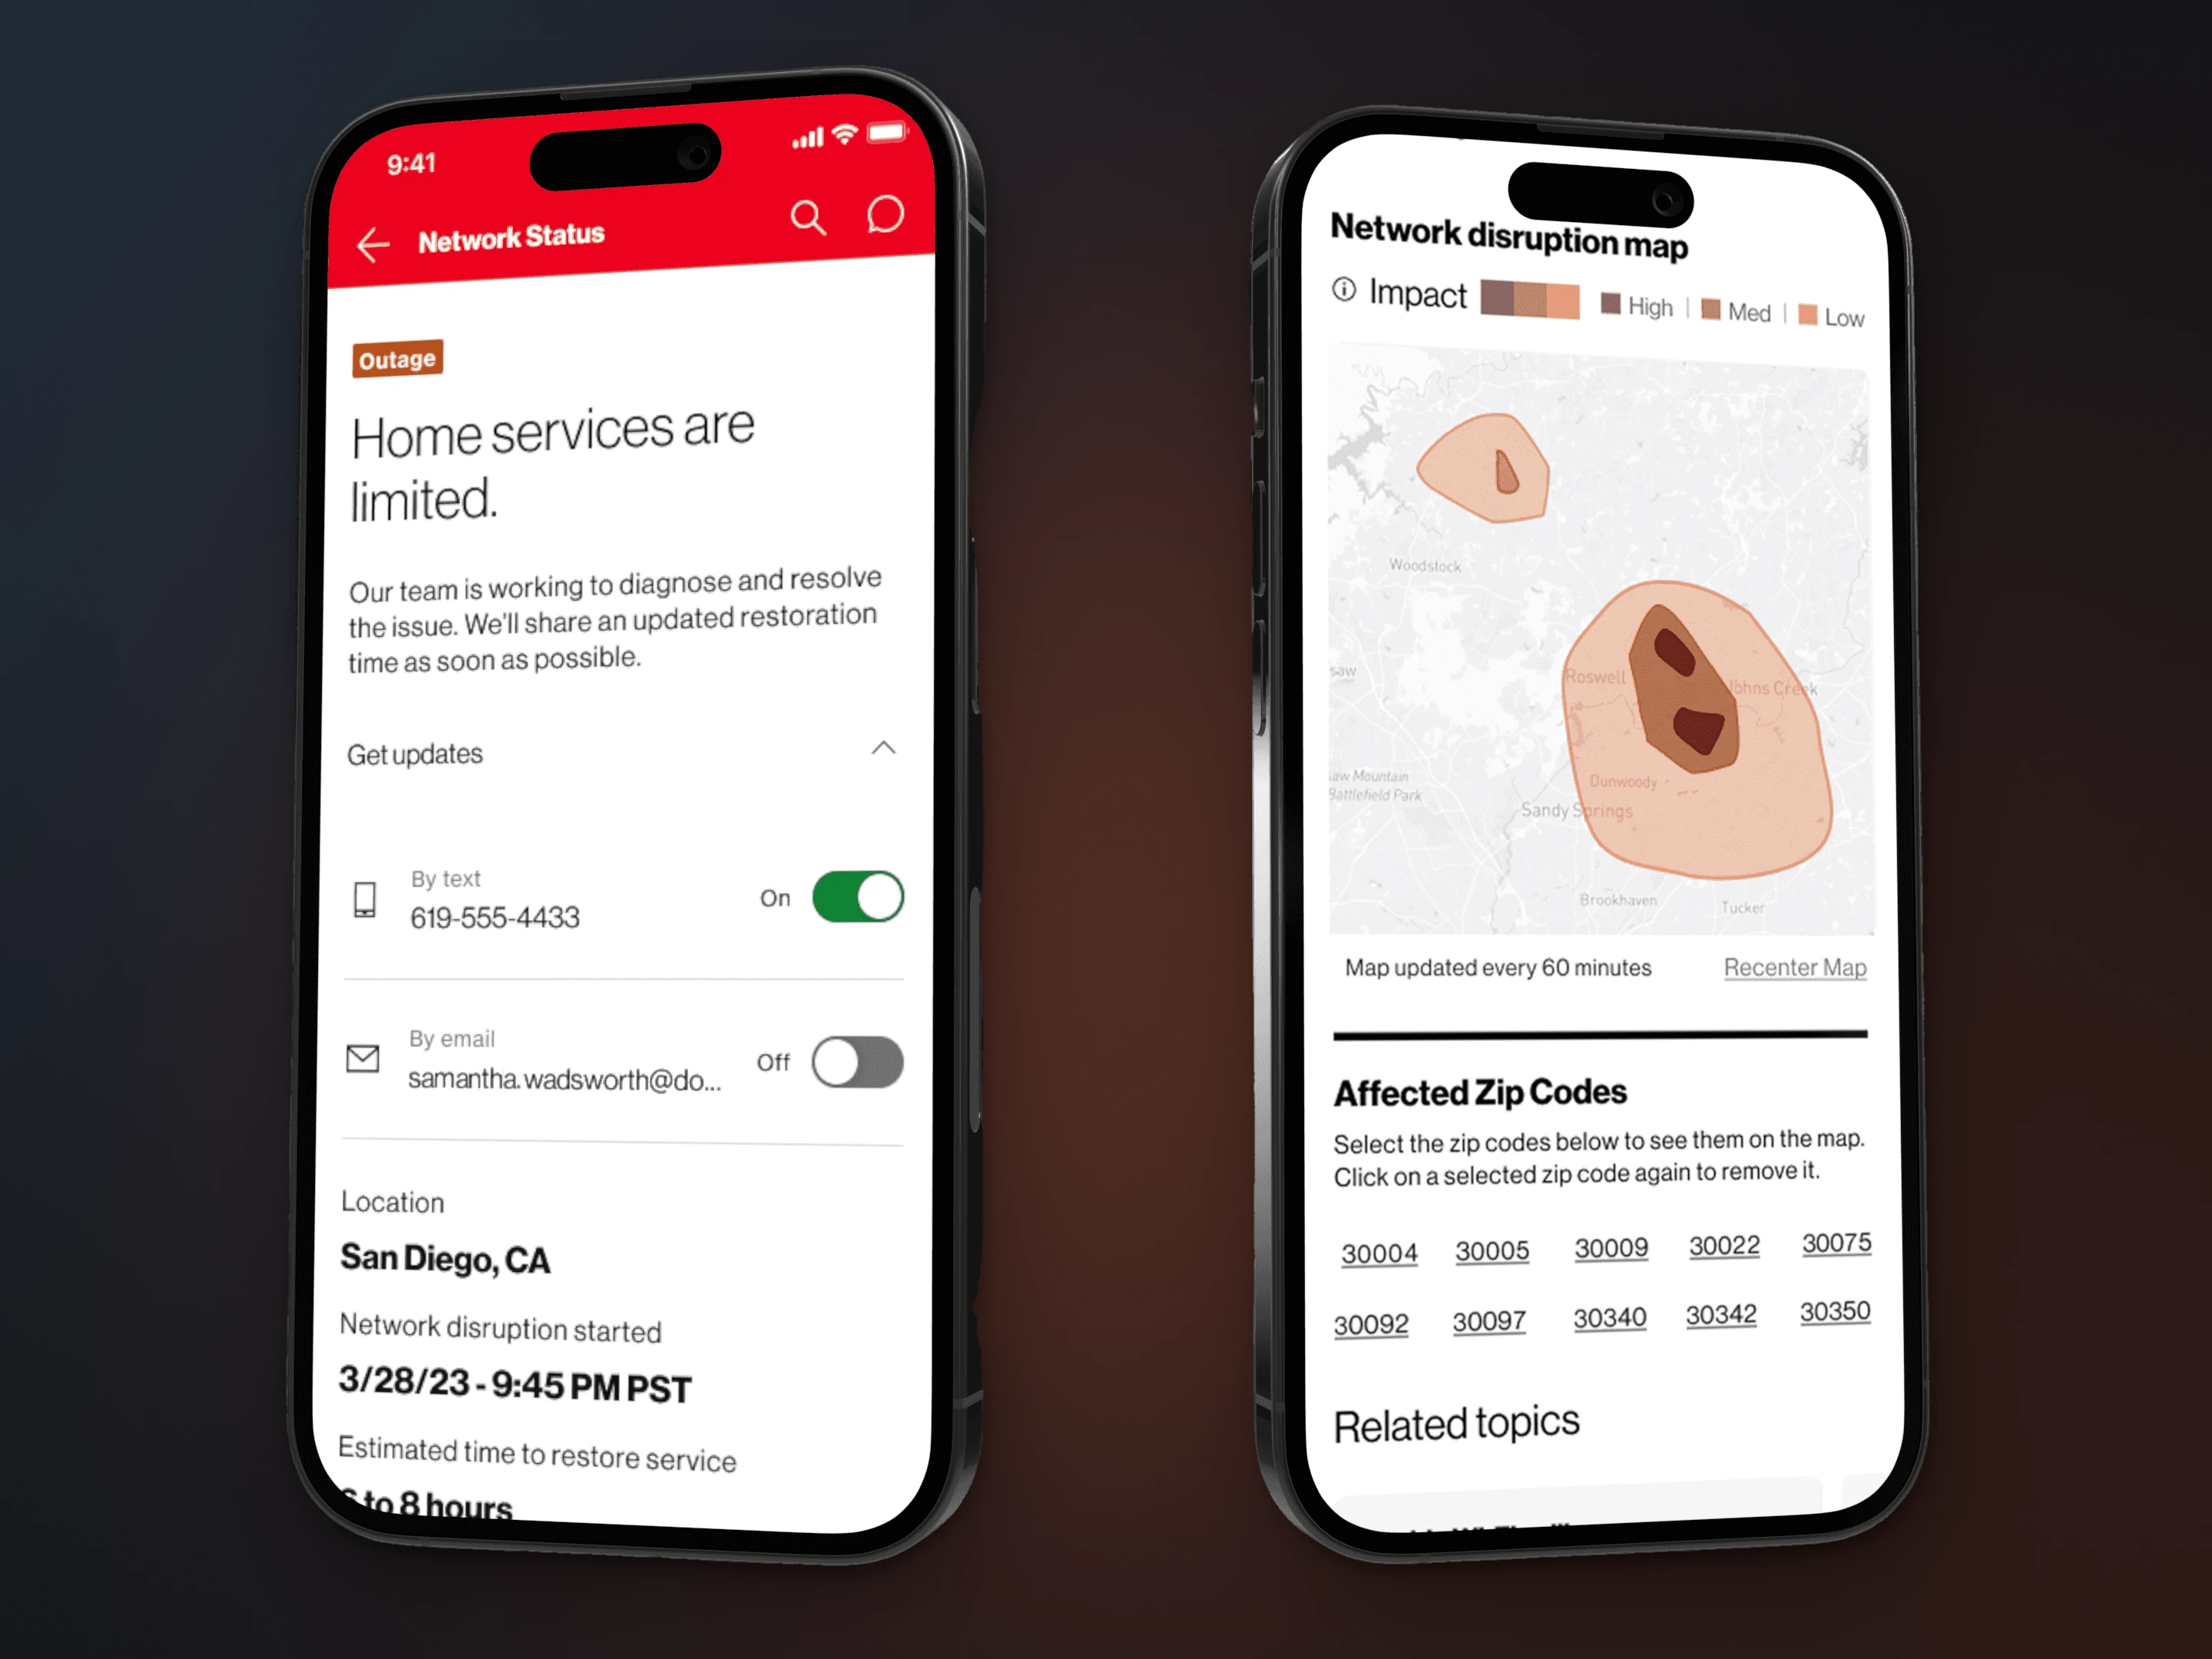
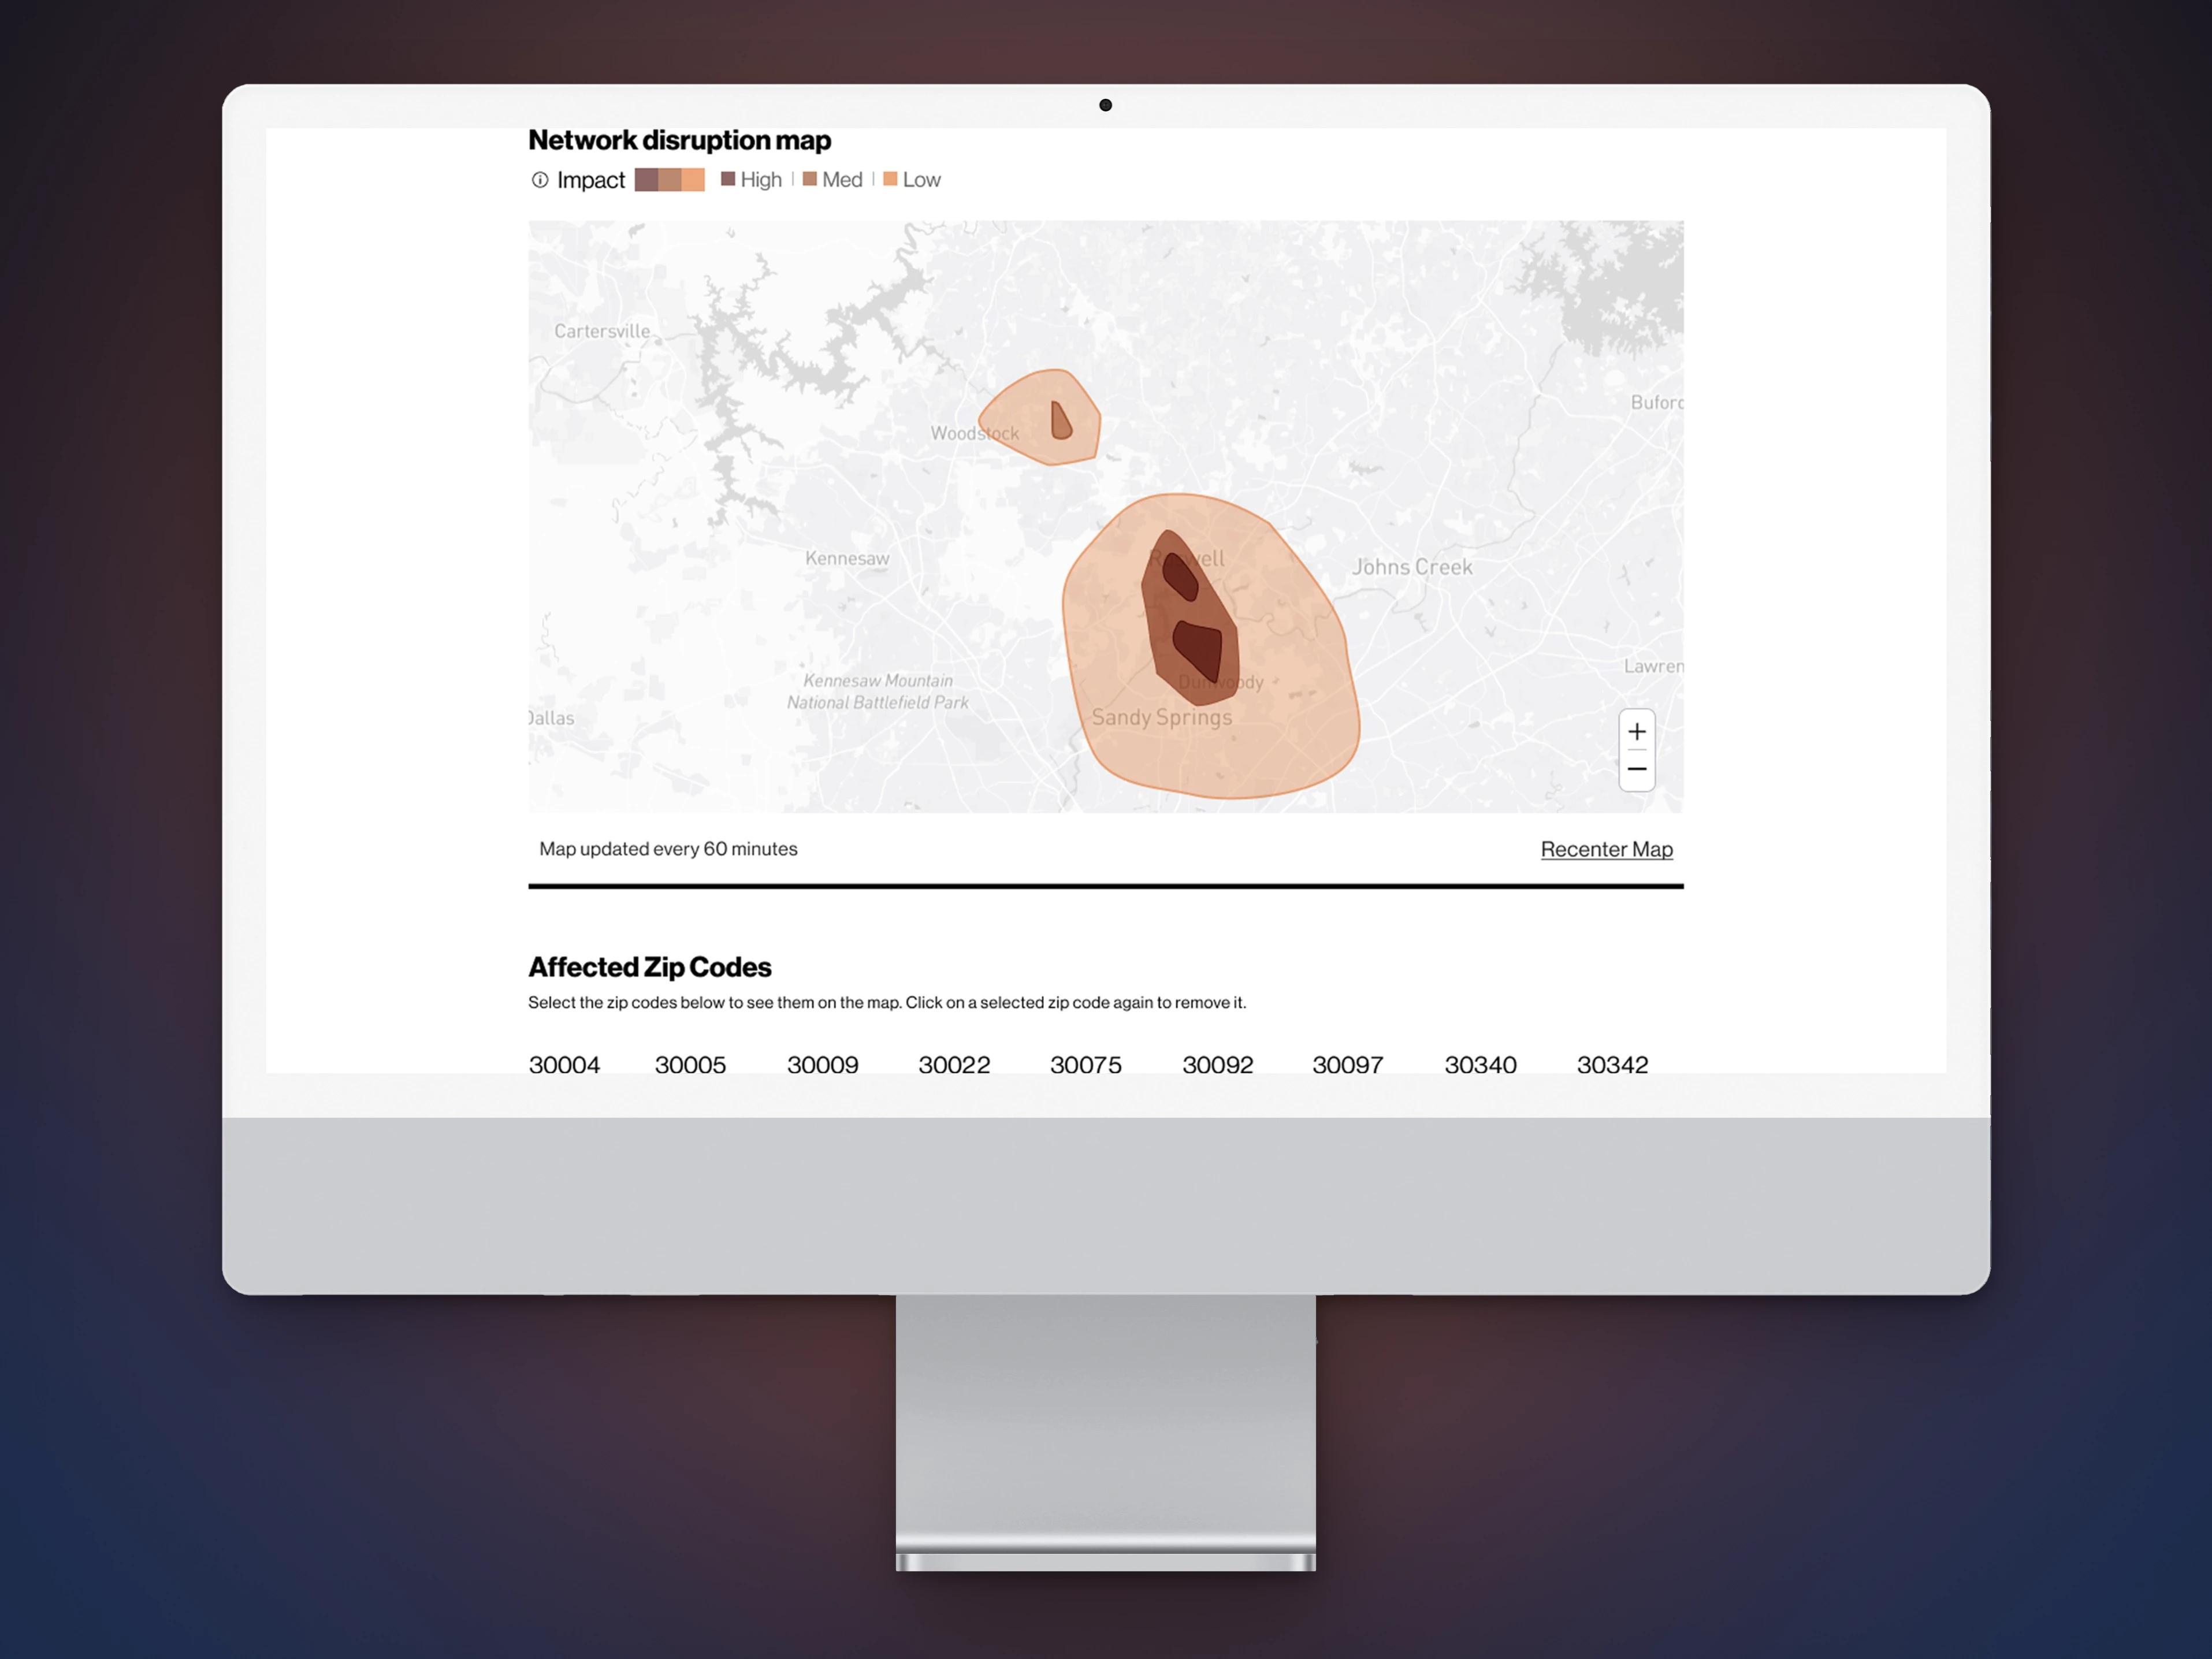
Does it affect me? A map with real edges
The map swapped the dot for high, medium and low impact zones that customers can check against their own street. I tested color and shape with customers in rural, suburban and urban areas, then made two calls.
- HeldOrange, not red. The AVP of Design wanted red to match the coverage map. I brought research showing customers preferred orange, and the design system team backed it with brand guidance against red for bad news. Orange shipped.
- TradedHexagons for nested zones. Customers read hexagons as more precise, but the map engine needed each zone drawn inside the next. I gave them up and met the deadline.
Outcomes
1.48%fewer calls about network connection issues, measured over a year
3–6Mpeople a month use the hub and map
What I’d do differently. Run research alongside stakeholder reviews, not after, so the Current/Upcoming fix could have made the MVP.